Written by
Simon Austin
July 9, 2026
When Joe Newton broke down a Brentford performance, he wasn’t just counting passes.
The First-Team Analyst wanted to know how often his side had run in behind the opposition defence and at what speed, in which moments, and how they ranked against other teams.
Tracking data made these questions answerable.

Newton told Episode #79 of the TGG Podcast: “Of course there are the generic metrics you can use, but how much do they actually tell you? You get so much more context with the tracking data.”
This data, which tracks every player and the ball in every moment of every match, wasn’t available in the Championship at the time.
“If I really wanted to know that from a post-match point of view – how many times we did it – the only way in the Championship would be for me to manually tag it,” Newton explained.
“And that would be limited to just our games, because we wouldn’t have the time to go through every Championship game.”
When the Bees entered the Premier League for the first time in 2021/22, they suddenly had access to this goldmine of tracking data. The official provider for the league is Genius Sports and their Account Manager Adam Ridgewell told the TGG Pod: “Your event data will tell you X, Y co-ordinates – where stuff is on the pitch.
“But that’s only of the actions that happen – if player A passes to player B, you’ll know where they were.
“With tracking data, you then know where everybody else is when that pass happens too. So off-ball runs, pressures, locations between the lines become more powerful.
“You can start to do what I’d call things that didn’t happen. Maybe your centre-back has the ball and a team-mate was available between the lines but didn’t get the pass. You can find those moments as well.”
Performance Studio, Genius Sports’ analytics and video platform, then turned the tracking data into something that an analyst like Newton can derive rich insights from.
Built around GeniusIQ, the company’s data and AI engine, Performance Studio pairs video with tracking and event data. It comes in several sections – and Brentford take every one.
The ‘four rooms’
Ridgewell, who spent 15 years as an analyst in the club game before crossing to the provider side, outlined Performance Studio’s four sections.
1. Insight
The multi-game video tool. Seven seasons of Premier League data with the tracking layered on top are searchable to a forensic degree.
“You do really simple stuff, like, ‘I want to see all of Erling Haaland’s shots,'” Ridgewell said. “But you could also say, ‘I want all of Haaland’s shots during a transition, that started in this area of the pitch, where Kevin De Bruyne played a pass at some point.'”
A ranking function sits alongside, so any search can be set against the rest of the league. If Mohamed Salah completes 100 one-v-ones in a season, you can ask if that is a lot, per 90 minutes, compared to his peers.
2. Creator
Automates the repetitive coding that has long eaten an analyst’s hours.
“At Southampton, we created an XML and put it in all 380 Premier League games,” said Ridgewell, who was Analysis Operations Lead at the then-Premier League side.
“Save that onto a server, and any member of staff could take a game off it knowing it would be coded like a first-team analyst at Southampton would, in our philosophy.”
Now, an entire season’s footage, coded to one shared way of seeing the game, can be available to the whole department in seconds.
3. Fitness
Aggregates the tracking data into physical outputs – accelerations, high-speed running and so on – by player, team, game or season. Critically, this is interwoven with the tactical picture.
“You’d be able to find things like, show me who does the most sprints during attacking transitions,” Ridgewell said. “Which are the questions you get from coaches. They might say, I don’t think we sprint enough when we win the ball. But with the software you can actually find those things.”
4. Spotlight
The newest section, where teams turn the numbers into the spider plots, timelines, average shapes and formations that fill a modern opposition dossier or post-match report.
Seen through a player’s eyes
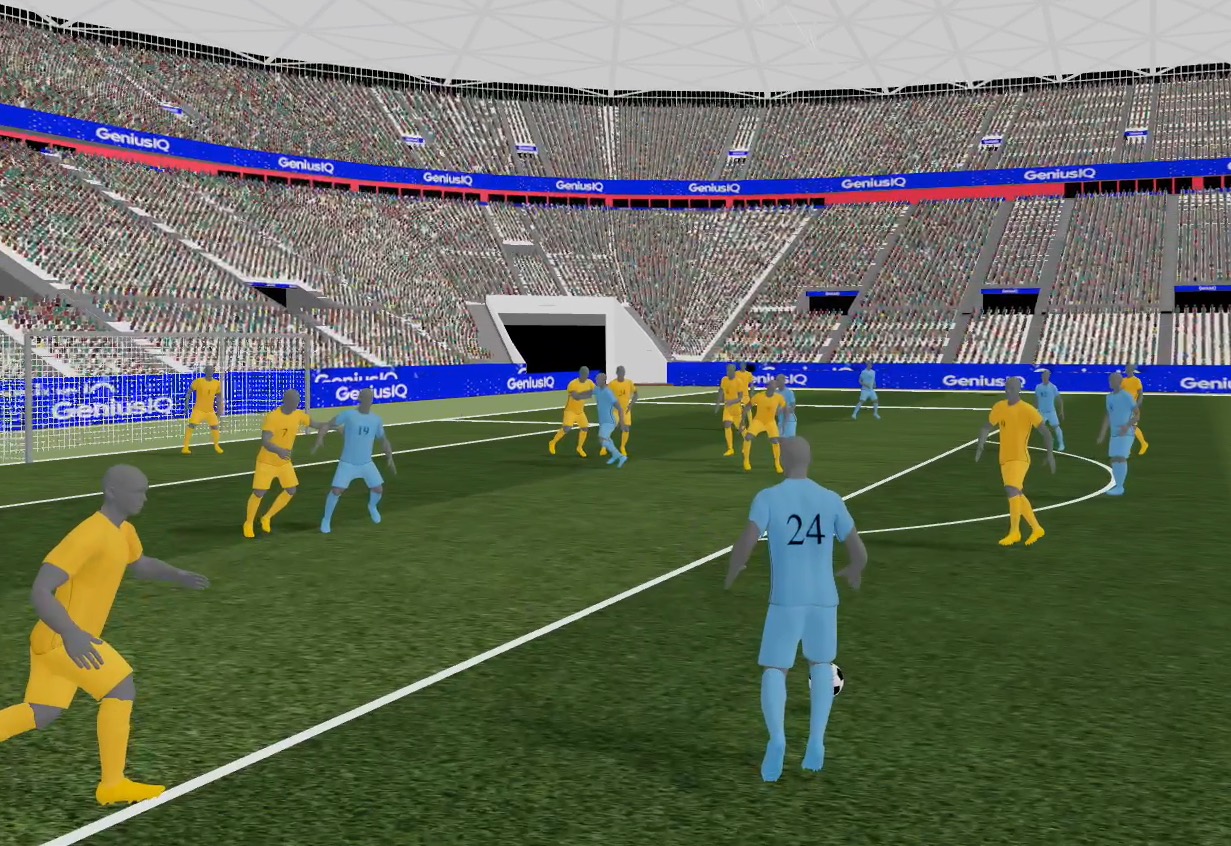
ProView3D is a viewing option and capability that sits across the video environment in Performance Studio, powered by mesh tracking and GeniusIQ.
It uses mesh tracking data to rebuild a match as a navigable 3D environment. This is a “digital twin” that the analyst can move through at will – and it enables them to see what the player saw on the pitch.
“You might get a player watching his tactical video back saying, ‘That’s not what I saw, you can’t just pause it and tell me that pass was on,'” Ridgewell said.
“But with this 3D world you can go and see what he could see at that moment. And it works both ways. Sometimes it’s, yes, that pass was on. Other times, I’m sorry, you’re right, it wasn’t. Or you prevent yourself from saying something to a player and creating that debate.”
You can drop the camera behind the goal for goalkeeper work, follow the play from a drone’s-eye view to mirror training footage, or step into any player’s position to see what they saw.

Getting buy-in
Newton spent six years as a First-Team Analyst at Brentford before following Frank to Tottenham, and has since joined Sunderland as an Opposition Analyst.
Ultimately, data and tech don’t really matter if the coaches won’t use them, he told the TGG Pod. Performance Studio earned its place at Brentford because Frank fully engaged with it.
“Thomas was really open and keen to know – once we introduced him to some of these metrics – ‘Oh, where are we for that?'” Newton said. “He’d be checking the opposition report, where it showed a league table in certain metrics, so he wasn’t just looking at where the next opponents are but where we are in the league too.”
The analyst’s skill is pitching the complexity to the audience: richer metrics with the coaches, then translated into something clean for the players.
“I could use more complex metrics with the coaches, because they were more familiar with it,” Newton said. “Then we adapt it when we deliver to the players, or are really clear on what that metric actually means.”
From DVDs on a motorbike
To see how far the profession has come, Ridgewell explained where he started. He began his career at Birmingham City’s Academy before moving on to Bristol Rovers, The Football Association, MK Dons and Doncaster Rovers, before joining Southampton in 2018.
“When I started, we were still giving DVDs to a guy on a motorbike, who’d take it off and get it processed somewhere else, and you’d get your data back a day or two later,” he said. “There were no league-wide shares, so you’d be emailing people, ‘Can you send me this game footage.'”
The departments have changed shape as much as the tools have.
“Most teams had one or two analysts, whereas now departments have several people and those roles are specialised – set-piece analysts, training analysts,” he said.
“Now you have coach-analysts who go on the grass, sit on the bench. And managers take analysts as key staff, because they often know the best way to show a philosophy in video.”
The frontier now, he says, is AI stripping out the manual grind, freeing analysts to interrogate the footage rather than assemble it.
- Adam Ridgewell’s full interview features in the second half of Episode #79 of the TGG Podcast, in association with Genius Sports.
Follow Us
For latest updates, follow us on X at @ground_guru