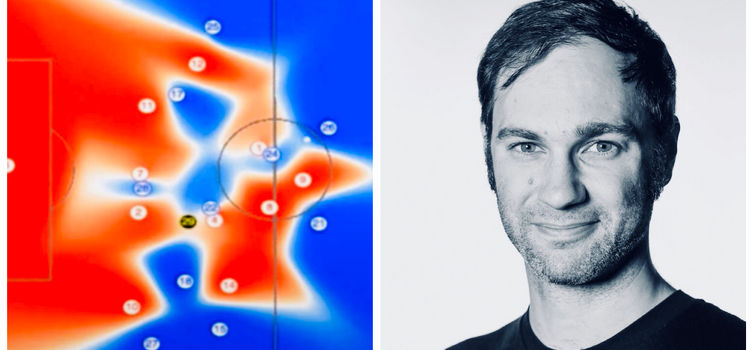
William Spearman: How Liverpool create pitch control models

Spearman has worked for Liverpool since March 2018
Written by Simon Austin — April 16, 2020
WILLIAM SPEARMAN is at the vanguard of a new breed of practitioners who have brought advanced mathematics and physics into English football.
For his PhD at Harvard, the American studied particle physics and the mass and width of the Higgs Boson - hardly a typical area of interest for coaches. Since March 2018, he has been lead data scientist at Liverpool and is a key member of Ian Graham’s fabled research team at the club.
Data science in football can often seem abstract and theoretical, distant from the traditional worlds of coaching and tactics. This is why a presentation Spearman delivered for the Friends of Tracking YouTube channel earlier this week was particularly welcome.
During 32 enlightening minutes (which you can watch below), he delivered a step-by-step guide for building a pitch control model and quantifying the creation of space.
His colleague, Tim Waskett, had touched on pitch control in the Royal Institution Lectures last Christmas, but Spearman has really broken it down in a lot more detail. It doesn’t takes a maths genius to realise how important the creation of space is during a match, nor how the modelling can be usefully applied during real-life situations.
Indeed, pitch-control models can be (and are) used live on the bench during games; they are important in pre-match and post-match analysis; and can also be used for evaluating potential signings.... by a small number of leading teams in the Premier League, at least.
Control
Spearman defines pitch control as "the probability that a player can control the ball, assuming it was at this location”.
Tracking data is key and was neatly explained by Waskett during his Christmas lecture.
“For Premier League games we get what is called tracking data,” he said. “This is a set of cameras all around the stadium monitoring the position of all the players plus the ball.
“It does that for 25 frames a second, for the full 90 minutes, so you end up with approximately 1.5 million data points.”

Using a voronoi tessellation (pictured), Spearman splits the pitch into regions that are closest to one another. When working out pitch control, he focuses on the time it takes a player to get to the ball, rather than their distance from it.
Maximum speed and acceleration are used to work out how long it will take them to reach it, then uncertainty is introduced because, as we all know, little in football is certain. This all allows Spearman to work out the level of control different players have on the ball.
At Hudl, the data scientist built a tool showing pitch control in video form, dynamically representing how space is closed down or opened up during a game, which you can see below. However, different models need to be built on top of this, or else it is "little more than a visual tool”.
Context
Having more pitch control doesn't necessarily mean your team's performance is better. If your goalkeeper has a lot of pitch control with his team is in possession, it usually means little.
Relevant pitch control is what's key, and this is calculated by focusing on the space closer to the ball. Another important factor is the motion of the ball. If Andy Robertson rakes a cross-field pass, for example, then it might take three seconds for the ball to reach Trent Alexander-Arnold on the opposite flank, by which time the situation on the pitch will likely have changed.
Also, not all parts of a pitch are equal. The space behind the opposition defence is infinitely more valuable than the space in front of the keeper with his team in possession, for example; so this is factored in as well.
'Control force’ is the probability of a player making a controlled touch of the ball - and 90% of the time it will take just a second for a player to make a controlled touch.
This control force is broken down into time steps and Spearman also works out how long it will take a player to reach the ‘interception point’, using their personal maximum speed and acceleration.
All of these factors are combined to work out the probability of each player receiving a pass, giving “a full holistic view of where this pass is likely to be received and by whom”.
A ‘scoring opportunity model’ uses distance to the goal and the probability of scoring in a current time frame, while 'off-ball scoring opportunity' highlights areas of the pitch where the next ball of a scoring chain is likely to come from (this is worked out by multiplying pitch control by the probability of scoring at each point on the pitch).
Scoring opportunity maps can then be built using all of this information.
How is this used?
Some of this is pretty involved - and I’ve heavily condensed Spearman's excellent presentation in this piece - but the implication of the application is significant.
These models can be used during matches, by a coach on the bench via a tablet, which has been permitted since the 2018 World Cup. Seeing where space can be created on the pitch - and where you’re vulnerable as well - is massively useful while a game is in progress.
There is one important caveat to bear in mind here though: there is typically a seven-minute lag in the tracking data received during a match, as well as some accuracy issues with the 'live' data.

After a match, the tracking data is reprocessed and much more accurate. There is also a bank of tracking data for every team in the Premier League over the last three or four seasons, meaning this modelling can become an important part of pre-match analysis of an opponent.
The modelling is also valuable for post-match analysis of your own team’s performance, and during his presentation Spearman talks about “player trend opportunities” for a right-back (pictured above).
Recruitment is also a key area of application. At Christmas, Waskett explained: “The advantage is we see all the players at the same time, which means we can analyse all the players in the Premier League and a large number of players in other leagues around the world. That gives us some really good information on which players are doing well and who we might be able to sign in the future.”
Translation into video at the end of the process is usually pivotal, because coaches and managers tend to prefer to see the game, rather than data or computer representations of it.


-1.png)


