Jason Todd: UEFA’s live data workflows at Euro 2024
Written by
Jason Todd
February 3, 2025
When I joined UEFA as Strategic Performance Analysis Lead in May 2024, one of my first main tasks was to help streamline and enhance analysis delivery ahead of the upcoming Euro 2024 tournament.
We needed to be able to get our insights out quicker and to move away from manual interpretation and coding. This would then enable our highly-skilled analysts to contextualise the game and assure our Technical Observers that they had great support.
Catapult’s performance analysis software MatchTracker was crucial in enabling us to sync our event data, tracking data and video and to build out some bespoke workflows.
Jason Todd is Strategic Performance Analysis Lead for UEFA and has previously worked for the English FA, Northern Irish FA, Norwich City and Blackburn Rovers. This article is taken from his presentation at TGG’s Big Data 2024 Webinar.
Sessions with: Dominic Jordan, Gregg Broughton, Jason Todd, Pegah Rahimian, Sebastien Coustou, Adam David, Lucy Rowland and Mladen Sormaz.
Analysis and technical department
For anyone who doesn’t know what UEFA’s Analysis and Technical Department does at a major tournament, it’s important to set the scene. At Euro 2024, we had various publications and awards we worked on in collaboration with the Technical Observer Group:
- Technical Report – a 100-plus page document that has to be finalised two weeks after the tournament.
- Group stage previews (2).
- Player of the Tournament.
- Goals of the Tournament.
- Bespoke articles (21).
- Player of the Match (51).
- Young Player of the Match.
- Team of the Tournament.
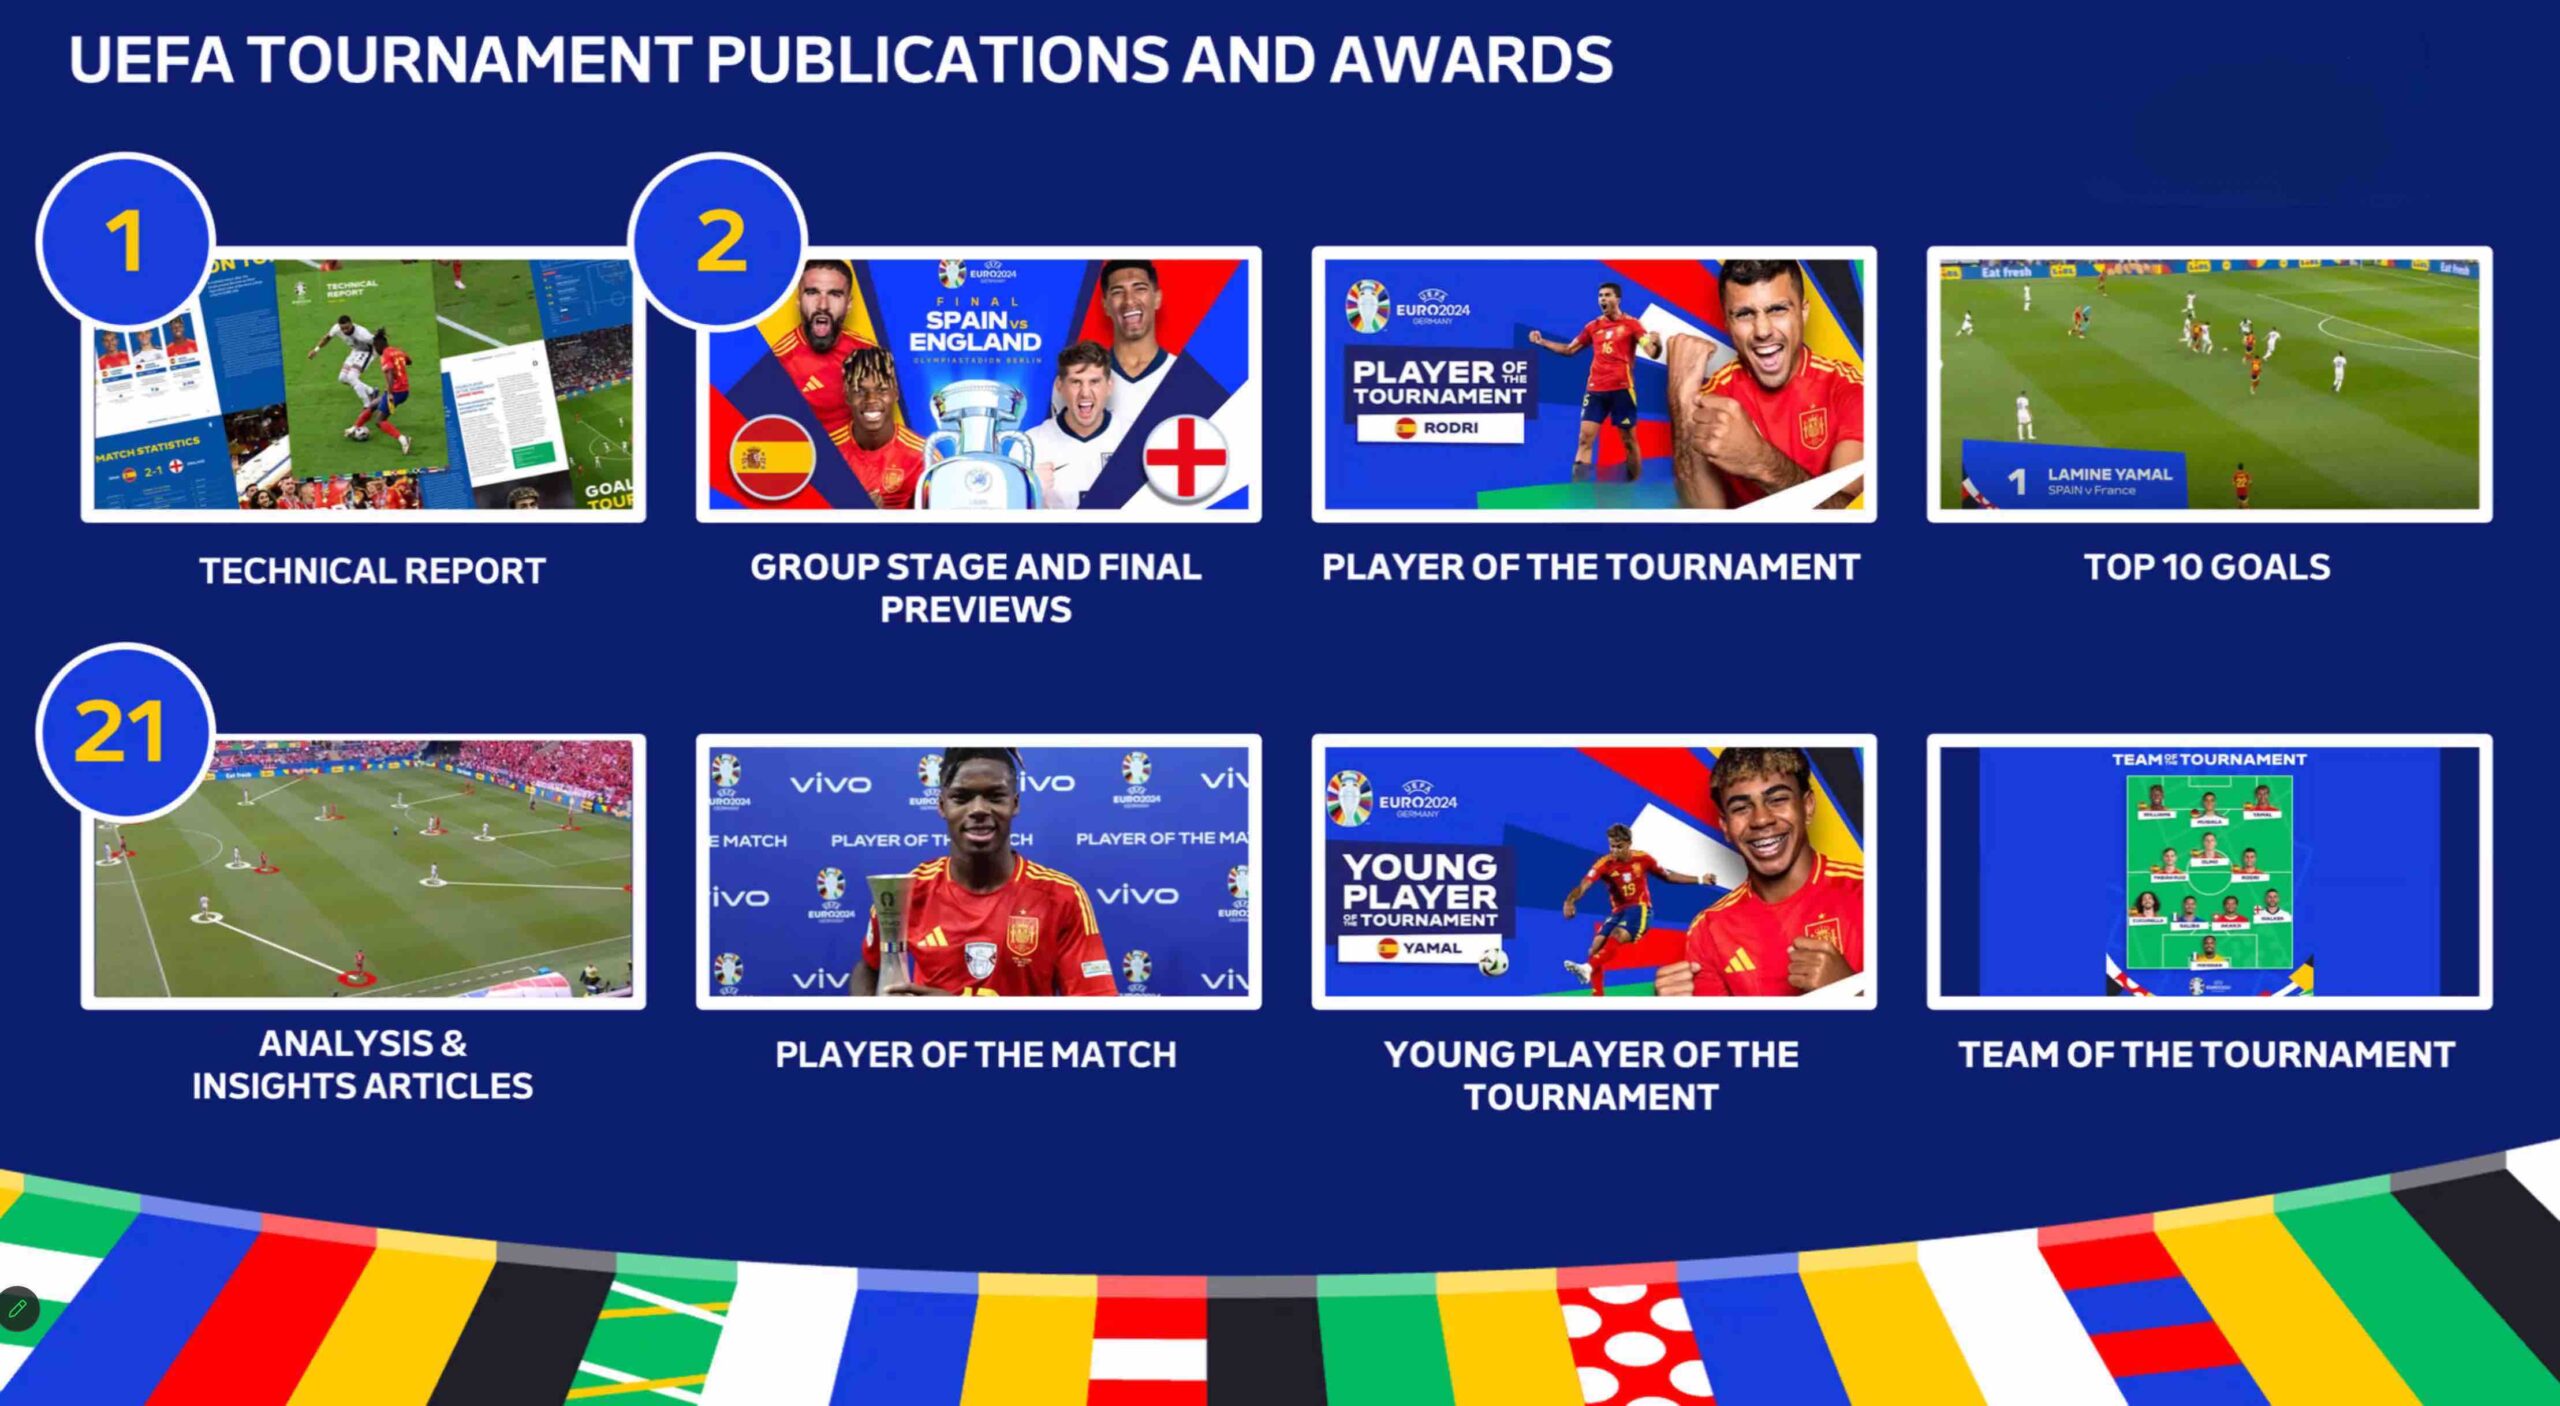
UEFA publications
Technical observer group
UEFA have 86 Technical Observers who we rely on throughout any of our competitions. For the Euros, there were 12 Technical Observers and their main role was to provide insights and tactical analysis live from the stadium during a game.
The Technical Observers were in live communication with the Analysis Hub in Nyon. In the Hub, we had a group of analysts, some data scientists and support from Catapult. Our job in the Hub was to provide the Observers with real-time highlights and anything they wanted to see from additional angles.
Eight camera angles were coming in in from every game, as well as live information from the Technical Observers. The next stage was live integration, which is where MatchTracker came in.
Lead-up
We had six weeks ahead of the Euros to pull all of this work together. It was semi-finals of the Champions League, leading into the major tournament of the summer, so time was against us, but we had real clarity and vision of what we were going after and why.
The first step was to do some research and have conversations about what we wanted to do and why.
Then we started to work on integration – how to bring MatchTracker into our world, how to use it, how to make sure the event and tracking data would work within it. We went through a robust testing process, relying on Catapult and our tracking provider to make sure everything worked and was seamless.
From that we went into our testing phase in the Champions League final, which is the biggest match night in UEFA’s club calendar. We tested it, brought in our different camera angles, as well as the event and tracking data, to see if the combination of work could come through. Thankfully it did.
This was two weeks prior to the start of the Euros, so we still had a bit of time to work through any issues and recalibrate our workflows. The last part was to bring all this together, arriving two days before the start of the tournament. There were five members of the analysis team in Nyon and we also had Catapult staff with us to give an additional layer of support and context.
We had generic templates with eight sections with bespoke coding that accorded to the analysis department’s definitions in a range of topics. We then created multiple workbooks that populated throughout the game. These were completely contextualised, led by the observers and analysts.
Because we had that core work of quality analysts supporting this, we could rely on them to bring that insight together, bring in our own custom coding and layer the automated workflows on top.
Live data workflow
We automated, integrated and brought all that capture together with MatchTracker, so we had up to eight angles of every game, plus all the live tracking and event data, in a single source.
In Nyon, we had a huge screen we could split into multiple displays. The analyst had his own capture going on and we had additional screens with live data being pumped out. The observers were able to get that information live and see the video from additional angles.
We were able to customise this work according to what we wanted the outputs to show. When questions came in from the observers, we were able to export data and send screenshots, or anything the observer wanted to see. We had multiple ways of getting this information out.
The nice thing was that because we had it synced to the video, we could share that content with the observers and have deeper conversations. If we talk about a number at UEFA, we want to be able to see it and give context.
One of our biggest points of difference was animation effects. Jørn Kvamme, our Telestration Lead, used Vizrt to bring information from the Technical Observers and analysts to life, allowing us to tell stories about the game in different ways. We always want our insights to land at all spectrums, from fans to analysts to high-level coaches and Associations.
The work was intense. On some days we were covering three games a day. At the end of the group stage, there were multiple games happening at the same time.
On top of the live workflows, we delivered consolidations meetings every day at UEFA HQ in Nyon, where the group of analysts got together after each game, consolidated the notes from our observer group, and reviewed the footage and data and made sure we were identifying what the emerging trends were.
Insight articles
We had a live analysis piece we would publish a day after the game and then a deeper dive into an insight article two days after the game. We could take the graphics and outputs from MatchTracker and then worked with Twelfth Man to produce the final output of our graphics in a 3D stadium visualisation.
We had articles on broken lines, on ball pressure, and much more. From using the Average Formation tool in MatchTracker, we could pinpoint certain articles, bringing that tactical insight to life. We looked at runs in behind, all taken from the tracking data.
Technical reports
UEFA brings all this work together every year in their Technical Reports. There are Reports for all our club senior competitions and elite youth as well. In the reports, our Analysis and Technical Observer teams come together to show insights and trends throughout UEFA competitions.
Everything we do is published, so everyone can jump in. The other nice bit is all the screenshots and videos, which you can download for free.
After we’ve brought all this information together, UEFA hosts the National Team Coaches Conference, in early September, where the Technical Division presents all the trends from the Euros to the national managers and Technical Directors from the National Associations.
We also present what this means for elite youth development, so the Technical Directors can take that information back to their Associations and hopefully shape the next set of players coming through.
Follow Us
For latest updates, follow us on X at @ground_guru
