
Paul Power: How to properly compare players
Written by Paul Power — February 14, 2021
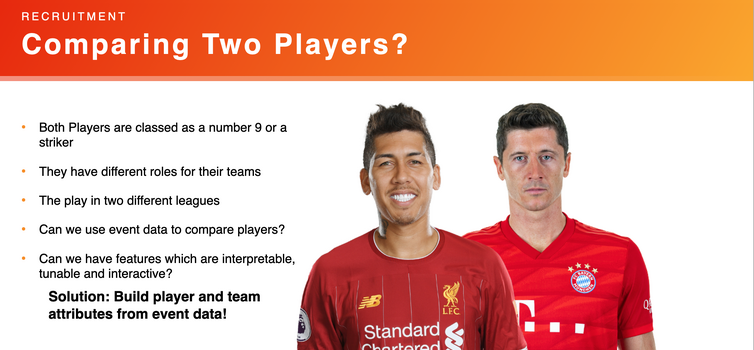
ROBERTO FIRMINO and Robert Lewandowski might both wear the number 9 on their backs, but they don't actually have too much in common as players.
The duo have completely different roles in teams that play with different styles in leagues with different demands. This shows why it’s important for us to be able to take a step back from the traditional labels of positions and properly compare and evaluate players.
In this article, I'll explain how we do this at Stats Perform. To carry out these comparisons and evaluations, we need to be able to make features that are interpretable, tunable and interactive.
By interpretable, I means being able to show the features to a coach so they will understand what they mean; by tunable I mean having the ability to weight variables according to what's important to you; and by interactive I mean the ability to provide simulations.
Attributes
We feel there are three main types of metric which are best for describing players.
The first is spatial. People are familiar with heat maps, but we go one step further with something called non-negative matrix factorisation (catchy title, I know).
With this model, we feed in a load of event data, the Xs and Ys, and it starts to learn spatial distributions. So rather than having one big heat map, it learns different regions on the pitch and rates the importance of them for a particular player.
Then we have our contextual attributes, represented by movement chains. These are sequences of play in which we take the first and last touch by a particular player and combine them, which allows us to compare the sequences of multiple players and teams in a nice standardised way.
This helps us to understand how a player influenced the sequence of play. Did they start the move? Were they in the middle of it? Did they cause it to regress?

And, finally, we’ve got quality metrics, like expected passes, possession value and expected goals. For keepers we have one additional metric - the personalised save model.
Based on these metrics, we can learn a different narrative, rather than just, ‘Is this player a number 9?’
Spatial analysis
Spatial analysis shows us that Lewandowski is very much the fox in the box, whereas Firmino is operating a lot deeper, playing in the half spaces - basically a false 9.
And what about how they contribute to the team? Below are our playing style distributions - build-up, counter attack, direct play, fast tempo, high press, maintenance and sustained threat.
The thick line represents the average and the dot is the player. So if the player is to the right of the line, they contribute more; if they’re to the left, they contribute less.

We’re not saying that they’re better or worse as players because of where they are, we’re asking ‘what is their style?’ This is important, because it allows us to see how they could potentially fit into another team.
Will the team have to change how they play with the addition of this player? Will they have to move another player to accommodate them? And so on.
We can see that Lewandowski just isn’t a build-up player at all, he is the finisher, whereas Firmino is heavily involved in all of the build-up play for Liverpool.
Quality
The next part of the analysis for us is to basically ask: ‘How good is this player and how does he help us to score?’
Rather than looking at a single number, which can wash out a lot of signal, we want to understand context. To do this, we can break this analysis down by zones.
Here is the classic zone 14, or double penalty area, which shows us that Firmino is in the 93rd percentile for possession value (ie he makes the most dangerous passes) and in the 91st percentile for expected passes.

Lewandowski is in the bottom 6% for possession value and above average (67th percentile) for expected passes, but still way behind Firmino on that metric.
We can look at other quality metrics, such as where they shoot from. Red is above average, blue is below and white is average. You can see that Lewandowski is mainly taking his shots from inside the penalty area, whereas Firmino is a lot more avant garde with his shooting positions.
Bringing it all together
Finally, we take all of these features and do something called a dimensionality reduction, in which we take about 100 features and smash them down into a two-dimensional representation.
In this case we’re using something called a t-SNE, which takes multi-dimensions and visualises them in 2D, which makes them much easier to understand.
We use a gaussian mixture model (most people’s favourite clustering technique), which is like a point on a map and enables us to learn about distributions. Using this model, we can identify different roles within positions.
So with right-backs, we have playmakers, like Trent Alexander-Arnold and Hamari Traore, and zone movers, like Luca Digne and Ben Chilwell.
With midfielders, we have conductors (Jorginho and Toni Kroos), facilitators (Casemiro and Santiago Ascacibar) and dynamos (Kai Havertz and N'Golo Kante).
And with the more attacking players, we have people who carry the ball forward, (Andrea Petagna and Richarlison), instigators (Lionel Messi and Firmino), and pure forwards (Lewandowski and Duvan Zapata).

Paul Power is a senior artificial intelligence manager at Stats Perform. He applies machine learning techniques to tracking & event data to create new models that capture tactical behaviour. This article was taken from his presentation at the Big Data Webinar.

-1.png)


